Djangoで家計簿のWebアプリケーションを作る8 Chartjsを使ってグラフを描画する
久しぶりのエントリーです。今回は前々から言っていた、JavaScriptを用いたグラフの描画を行います。これまではPythonのMatplotlibを使ってSVG画像を作り、それをページに表示してきました。これをChartjsを使って書き直すことで、グラフ上にカーソルを移動させたときに値を表示するなどの、画像ではできなかったことを実現します。
前回の記事は下にあります。
pyhaya.hatenablog.com
Chartjsとは
ChartjsとはJavaScriptを使ってHTML上にきれいなグラフを表示させることができるものです。
Chartjsを使ったグラフは公式サイトに様々載っていますが、どれもとてもきれいです。
www.chartjs.org
これはどうしても使ってみたいと思い、試行錯誤してみました。
どうやってDjangoのプロジェクトでChartjsを使うか
ChartjsはプロットするデータをJSON形式で入力します。「Chartjs 使い方」などと検索するとプロットデータをソースコードにべた書きする例がいくつもヒットします。しかし今回の例だとプロットデータはデータベースからとってきたいのでここが悩みの種です。私はこれまでJavaScriptを触ったことがなかったので、ずいぶん苦労しました。
いろいろ試行錯誤した結果、最終的には下のような方法で実現できました。
- Pythonでデータベースからその日ごとの出費を取得する
- PythonでJavaScriptのソースコードを書きだす
- JavaScriptでChartjsを使うコードを書いて描画
調べていると、JSONファイルを出力してそれをJQueryで読み込む例などが出てきたのですが、JS初心者には難しすぎたので(笑)今回は上の方法でやります。
コードを書く
HTMLを編集する
まずはHTMLから整えていきます。前回までのHTMLファイルはさすがにひどかったので今回はBootstrapを組み込んでスタイルを一新しました。
<!DOCTYPE html>
{% load static %}
<html lang='ja' dir="ltr">
  <head>
    <meta charset="utf-8">
    <title>MoneyBook</title>
    <script src="https://code.jquery.com/jquery-3.3.1.min.js" integrity="sha256-FgpCb/KJQlLNfOu91ta32o/NMZxltwRo8QtmkMRdAu8=" crossorigin="anonymous"></script>
    <link href="https://stackpath.bootstrapcdn.com/bootstrap/4.3.1/css/bootstrap.min.css" rel="stylesheet" integrity="sha384-ggOyR0iXCbMQv3Xipma34MD+dH/1fQ784/j6cY/iJTQUOhcWr7x9JvoRxT2MZw1T" crossorigin="anonymous">
    <script src="https://stackpath.bootstrapcdn.com/bootstrap/4.3.1/js/bootstrap.min.js" integrity="sha384-JjSmVgyd0p3pXB1rRibZUAYoIIy6OrQ6VrjIEaFf/nJGzIxFDsf4x0xIM+B07jRM" crossorigin="anonymous"></script>
    <script src="https://cdnjs.cloudflare.com/ajax/libs/Chart.js/2.1.4/Chart.min.js"></script>
    <link rel="stylesheet" href="//code.jquery.com/ui/1.12.1/themes/base/jquery-ui.css">
    <script src="https://code.jquery.com/ui/1.12.1/jquery-ui.js"></script>
    <link rel="stylesheet" type="text/css" href="{% static 'moneybook/main_style.css' %}">
    <script type="text/javascript" src="{% static 'moneybook/js/data.js' %}"></script>
    <script type="text/javascript" src="{% static 'moneybook/js/draw.js' %}"></script>
    <script>
      $(function () {
        let dateFormat = 'yy-mm-dd';
        $('#date_choice').datepicker({
        dateFormat: dateFormat
        });
      });
    </script>
  </head>
  <body>
    <div class="container">
      <div class="container-inner">
        <!-- ヘッダー -->
        <div class="row top-bg">
          <div class="col-md-8" >
            <h1>{{ year }}年 {{ month }}月</h1>
          </div>
          <div class="col-md-2 text-center mt-4">
            <a href="/moneybook/{{ prev_year }}/{{ prev_month }}">
              <h4> << {{ prev_month }}月</h4>
            </a>
          </div>
          <div class="col-md-2 text-center mt-4">
            <a href="/moneybook/{{ next_year }}/{{ next_month }}">
              <h4>{{ next_month }}月 >> </h4>
            </a>
          </div>
        </div>

        <!-- 支出の登録フォーム -->
        <div class="row">
          <div class="card">
            <div class="in-card">
              <h2>支出の登録</h2>
              <form action="" method="post" autocomplete="off" style="margin-top:3%;">
                {% csrf_token %}
                {% if form.errors %}
                  {% for errors in form.errors.values %}
                    {% for error in errors %}
                      <div class="alert alert-danger" role="alert">
                        {{ error }}
                      </div>
                    {% endfor %}
                  {% endfor %}
                {% endif %}
                <div class="form-group">
                  <div class="form-inline">
                    {{ form.used_date }}
                    {{ form.cost }}
                    {{ form.category }}
                  </div>
                  <hr>
                  <div class="form-inline">
                    {{ form.money_use }}
                    <input type="submit" name='add' class="btn btn-primary" value="登録">
                  </div>
                </div>
              </form>
            </div>
          </div>

          <!-- 総支出の表示 -->
          <div class="card">
            <div class="in-card">
              <h2>今月の総支出</h2>
              <div class="text-center total_cost">
                <h3 class="total">{{ total_cost }}円</h2>
              </div>
            </div>
          </div>
        </div>

        <div class="row">
          <!-- 支出履歴テーブル -->
          <div class="card">
            <div class="in-card">
              <h2>支出履歴</h2>
              <table style="table-layout:fixed;width:100%;margin-top:20px;">
                <thead class="pay_history">
                  <tr>
                      <th class="date">日付</th>
                      <th class="use">用途</th>
                      <th class="category">カテゴリー</th>
                      <th class="cost">金額</th>
                      <th class="delete">削除</th>
                  </tr>
                </thead>
                <tbody class="pay_history">
                  {% for m in money %}
                  <tr class="table_data">
                      <td class="date" id="table">{{ m.used_date.month }}/{{ m.used_date.day }}</td>
                      <td class="use" id="table">{{ m.money_use }}</td>
                      <td class="category" id="table">{{ m.get_category_display }}</td>
                      <td class="cost" id="table">{{ m.cost }}円</td>
                      <td class="delete" id="table">
                          <form action="" method="post">
                              {% csrf_token %}
                              <input type="hidden" name="used_date" value={{ m.used_date }}>
                              <input type="hidden" name="money_use" value={{ m.money_use }}>
                              <input type="hidden" name="cost" value={{ m.cost }}>
                              <button class="btn btn-outline-danger" type="submit" name="delete">
                                削除
                              </button>
                          </form>
                      </td>
                  </tr>
                  {% endfor %}
                </tbody>
              </table>
            </div>
          </div>

          <!-- 支出額の推移グラフ -->
          <div class="card">
            <div class="in-card">
              <h2>支出額の推移</h2>
              <canvas id="data"></canvas>
              <script type="text/javascript" src="{% static 'moneybook/js/draw.js' %}"></script>
            </div>
          </div>
        </div>
      </div>
    </div>
    <a href='/logout'>LOGOUT</a>
  </body>
</html>
描画に用いるのはdraw.jsという名前のJavaScriptファイルです。
JavaScriptコードを書く
PythonでJavaSciptコードを書くのですがさすがに全部書くのは嫌なので、2つに分けます。
data.jsdraw.js
data.jsにプロットするデータが含まれるようにして、他の部分はdraw.jsに書きます。
draw.js
var ctx = document.getElementById("data").getContext("2d");
var myChart = new Chart(ctx, json);   #変数jsonはdata.jsに書く
PythonでJavaScriptコードを生成する
ここが核になります。JavaScriptコードを生成するとかいうとなんか難しく聞こえますが open(file_name, 'w')を使って書き込むだけです。以下がソースコードです。
views.py
from django.shortcuts import render, redirect
from django.contrib.auth.mixins import LoginRequiredMixin
from django.views import View
from django.utils import timezone
import calendar
import os


from .models import ExpenditureDetail
from .forms import ExpenditureForm

TODAY = str(timezone.now()).split("-")
# Create your views here.


class MainView(LoginRequiredMixin, View):
    login_url = "/login"
    redirect_field_name = ""

    def get(self, request, year=TODAY[0], month=TODAY[1]):
        money = ExpenditureDetail.objects.filter(
            used_date__year=year, used_date__month=month, user_id=request.user.id
        ).order_by("used_date")

        total = 0
        for m in money:
            total += m.cost

        next_year, next_month = get_next(year, month)
        prev_year, prev_month = get_prev(year, month)

        context = {
            "year": year,
            "month": month,
            "next_year": next_year,
            "next_month": next_month,
            "prev_year": prev_year,
            "prev_month": prev_month,
            "total_cost": total,
            "money": money,
            "form": ExpenditureForm(),
        }

        self.draw_graph(year, month, request.user.id)

        return render(request, "moneybook/mainview.html", context)

    def post(self, request, year=TODAY[0], month=TODAY[1]):
        data = request.POST
        form = ExpenditureForm(data)

        if "add" in data.keys():
            if form.is_valid():
                used_date = data["used_date"]
                cost = data["cost"]
                money_use = data["money_use"]
                category_choices = data["category"]

                used_date = timezone.datetime.strptime(used_date, "%Y-%m-%d")

                ExpenditureDetail.objects.create(
                    user_id=request.user.id,
                    used_date=used_date,
                    cost=cost,
                    money_use=money_use,
                    category=category_choices,
                )

            money = ExpenditureDetail.objects.filter(
                used_date__year=year, used_date__month=month, user_id=request.user.id
            ).order_by("used_date")

            total = 0
            for m in money:
                total += m.cost

            next_year, next_month = get_next(year, month)
            prev_year, prev_month = get_prev(year, month)

            context = {
                "year": year,
                "month": month,
                "next_year": next_year,
                "next_month": next_month,
                "prev_year": prev_year,
                "prev_month": prev_month,
                "total_cost": total,
                "money": money,
                "form": form,
            }

            self.draw_graph(year, month, request.user.id)

            return render(request, "moneybook/mainview.html", context)

        elif "delete" in data.keys():
            used_date = data["used_date"]
            cost = data["cost"]
            money_use = data["money_use"]

            used_date = used_date.replace("年", "-").replace("月", "-").replace("日", "")
            y, m, d = used_date.split("-")

            ExpenditureDetail.objects.filter(
                used_date__year=y,
                used_date__month=m,
                used_date__day=d,
                cost__iexact=cost,
                money_use__iexact=money_use,
            ).delete()

            return redirect(to="/moneybook/{}/{}".format(year, month))

    def draw_graph(self, year, month, user_id):
        money = ExpenditureDetail.objects.filter(
            used_date__year=year, used_date__month=month, user_id=user_id
        ).order_by("used_date")

        last_day = calendar.monthrange(int(year), int(month))[1] + 1
        day = [i for i in range(1, last_day)]
        cost = [0 for i in range(len(day))]
        for m in money:
            cost[int(str(m.used_date).split("-")[2]) - 1] += int(m.cost)

        text_day = ",".join(list(map(str, day)))
        text_cost = ",".join(list(map(str, cost)))

        json_template = (
            """var json = {
            type: 'bar',
            data: {
                labels: [
        """
            + str(text_day)
            + """
                ],
                datasets: [{
                    label: '支出',
                    data: [
        """
            + str(text_cost)
            + """
                    ],
                    borderWidth: 2,
                    strokeColor: 'rgba(0,0,255,1)',
                    backgroundColor: 'rgba(0,191,255,0.5)'
                }]
            },
            options: {
                scales: {
                    xAxes: [{
                        ticks: {
                            beginAtZero:true
                        },
                        scaleLabel: {
                            display: true,
                            labelString: '日付',
                            fontsize: 18
                        }
                    }],
                    yAxes: [{
                        ticks: {
                            beginAtZero:true
                        },
                        scaleLabel: {
                            display: true,
                            labelString: '支出額 (円)',
                            fontsize: 18
                        }
                    }]
                },
                responsive: true
            }
        }
        """
        )
        with open(
            os.path.dirname(os.path.abspath(__file__)) + "/static/moneybook/js/data.js",
            "w",
        ) as f:
            f.write(json_template)


def get_next(year, month):
    year = int(year)
    month = int(month)

    if month == 12:
        return str(year + 1), "1"
    else:
        return str(year), str(month + 1)


def get_prev(year, month):
    year = int(year)
    month = int(month)
    if month == 1:
        return str(year - 1), "12"
    else:
        return str(year), str(month - 1)
とりあえずviews.pyの中身を全部載せていますが、描画に関係しているのは一番下のメソッドのみです。ここでやっていることは上のコメントを読めば大体わかると思いますが、JavaScriptコードをstringで用意しておいて、そこにデータを埋め込んでいく形になっています。ダブルクオーテーション3つでstringを作るとformat関数がうまく動いてくれないのでstringどうしを足しているため汚くなってしまっていますが、やっていることは単純です。
ちゃんと整ったコードは以下のサイトが非常に参考になると思います。
qiita.com
ここまでの結果
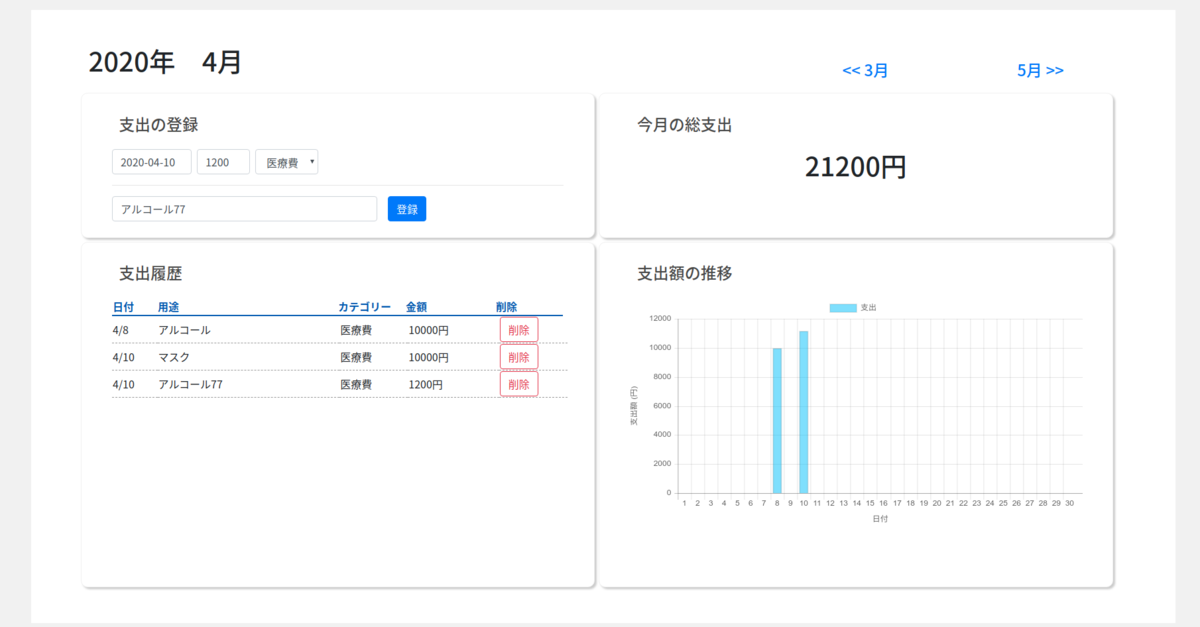
ここまでやってページを見てみると、次のようになります。

今話題のものを買い漁ってるふうにしてみました。ちゃんとできてますね。
まとめ
今回は、Chartjsを使ってグラフをより良いものにしました。その方法はJavaScriptコードをPythonから作るというものでした。これは私がJavaScriptわからな過ぎてとった苦肉の策なので、詳しい人から見たらベストプラクティスではないかもしれませんので注意してください(詳しい人いたら教えてください)。ぜんたいのコードは以下の GitHub リポジトリで公開しているのでここに乗せていない部分が気になる方はぜひこちらも見てください!